UX Research at Synopsys

Company Background
I worked at Synopsys, an Electronic Design Automation company based in Sunnyvale, CA, that creates tools and services that can be used by companies in the semiconductor design and manufacturing industries.
Role and Responsibilities
I led and executed the first user research study, in order to recommend future tool design changes and establish user research guidelines. I worked with the Software Engineering DevTools Team, which works on creating in-house tools for developers.
Problem Statement
Users of the developer tools need a redesigned interface in order to increase efficiency and make the user experience smoother.
Objectives
Discover tools that are used in conjunction with these developer tools and understand how they are used together.
Learn about pain points that users are encountering while using the tools.
Understand whether users are able to successfully and easily complete tasks with the tools.
Understand user motivations and behaviors and discover their desires for the user interface of the tools.
Recruitment
Sample Demographics
Population: 3,000-4,000 users within Synopsys across various teams
Engagement: Power Users, Heavy Users
Experience: Novice (0-2 years), Experienced (5+ years)
Geographical Areas: United States, India, France, China
Role: Developers, Architects, Manager
How were users recruited?
A randomized list of users who fit the criteria were given by the developer tools team and contacted for interviews.
All employees who used the tools received an email with the survey and were incentivized with a raffle giving up to 5 users a $20 gift card of their choice.
Research Methods
-
Interviews
30-minute zoom and in-person interviews were conducted across all 3 tools and 60 total interviews were completed

-
Surveys
A 17-question survey with closed and open ended questions was sent to 4,000 employees and 600 responses were collected.

-
Why?
Mixed methods enabled me to uncover deep user insights, while gathering quantitative evidence to back up these findings.
Analysis
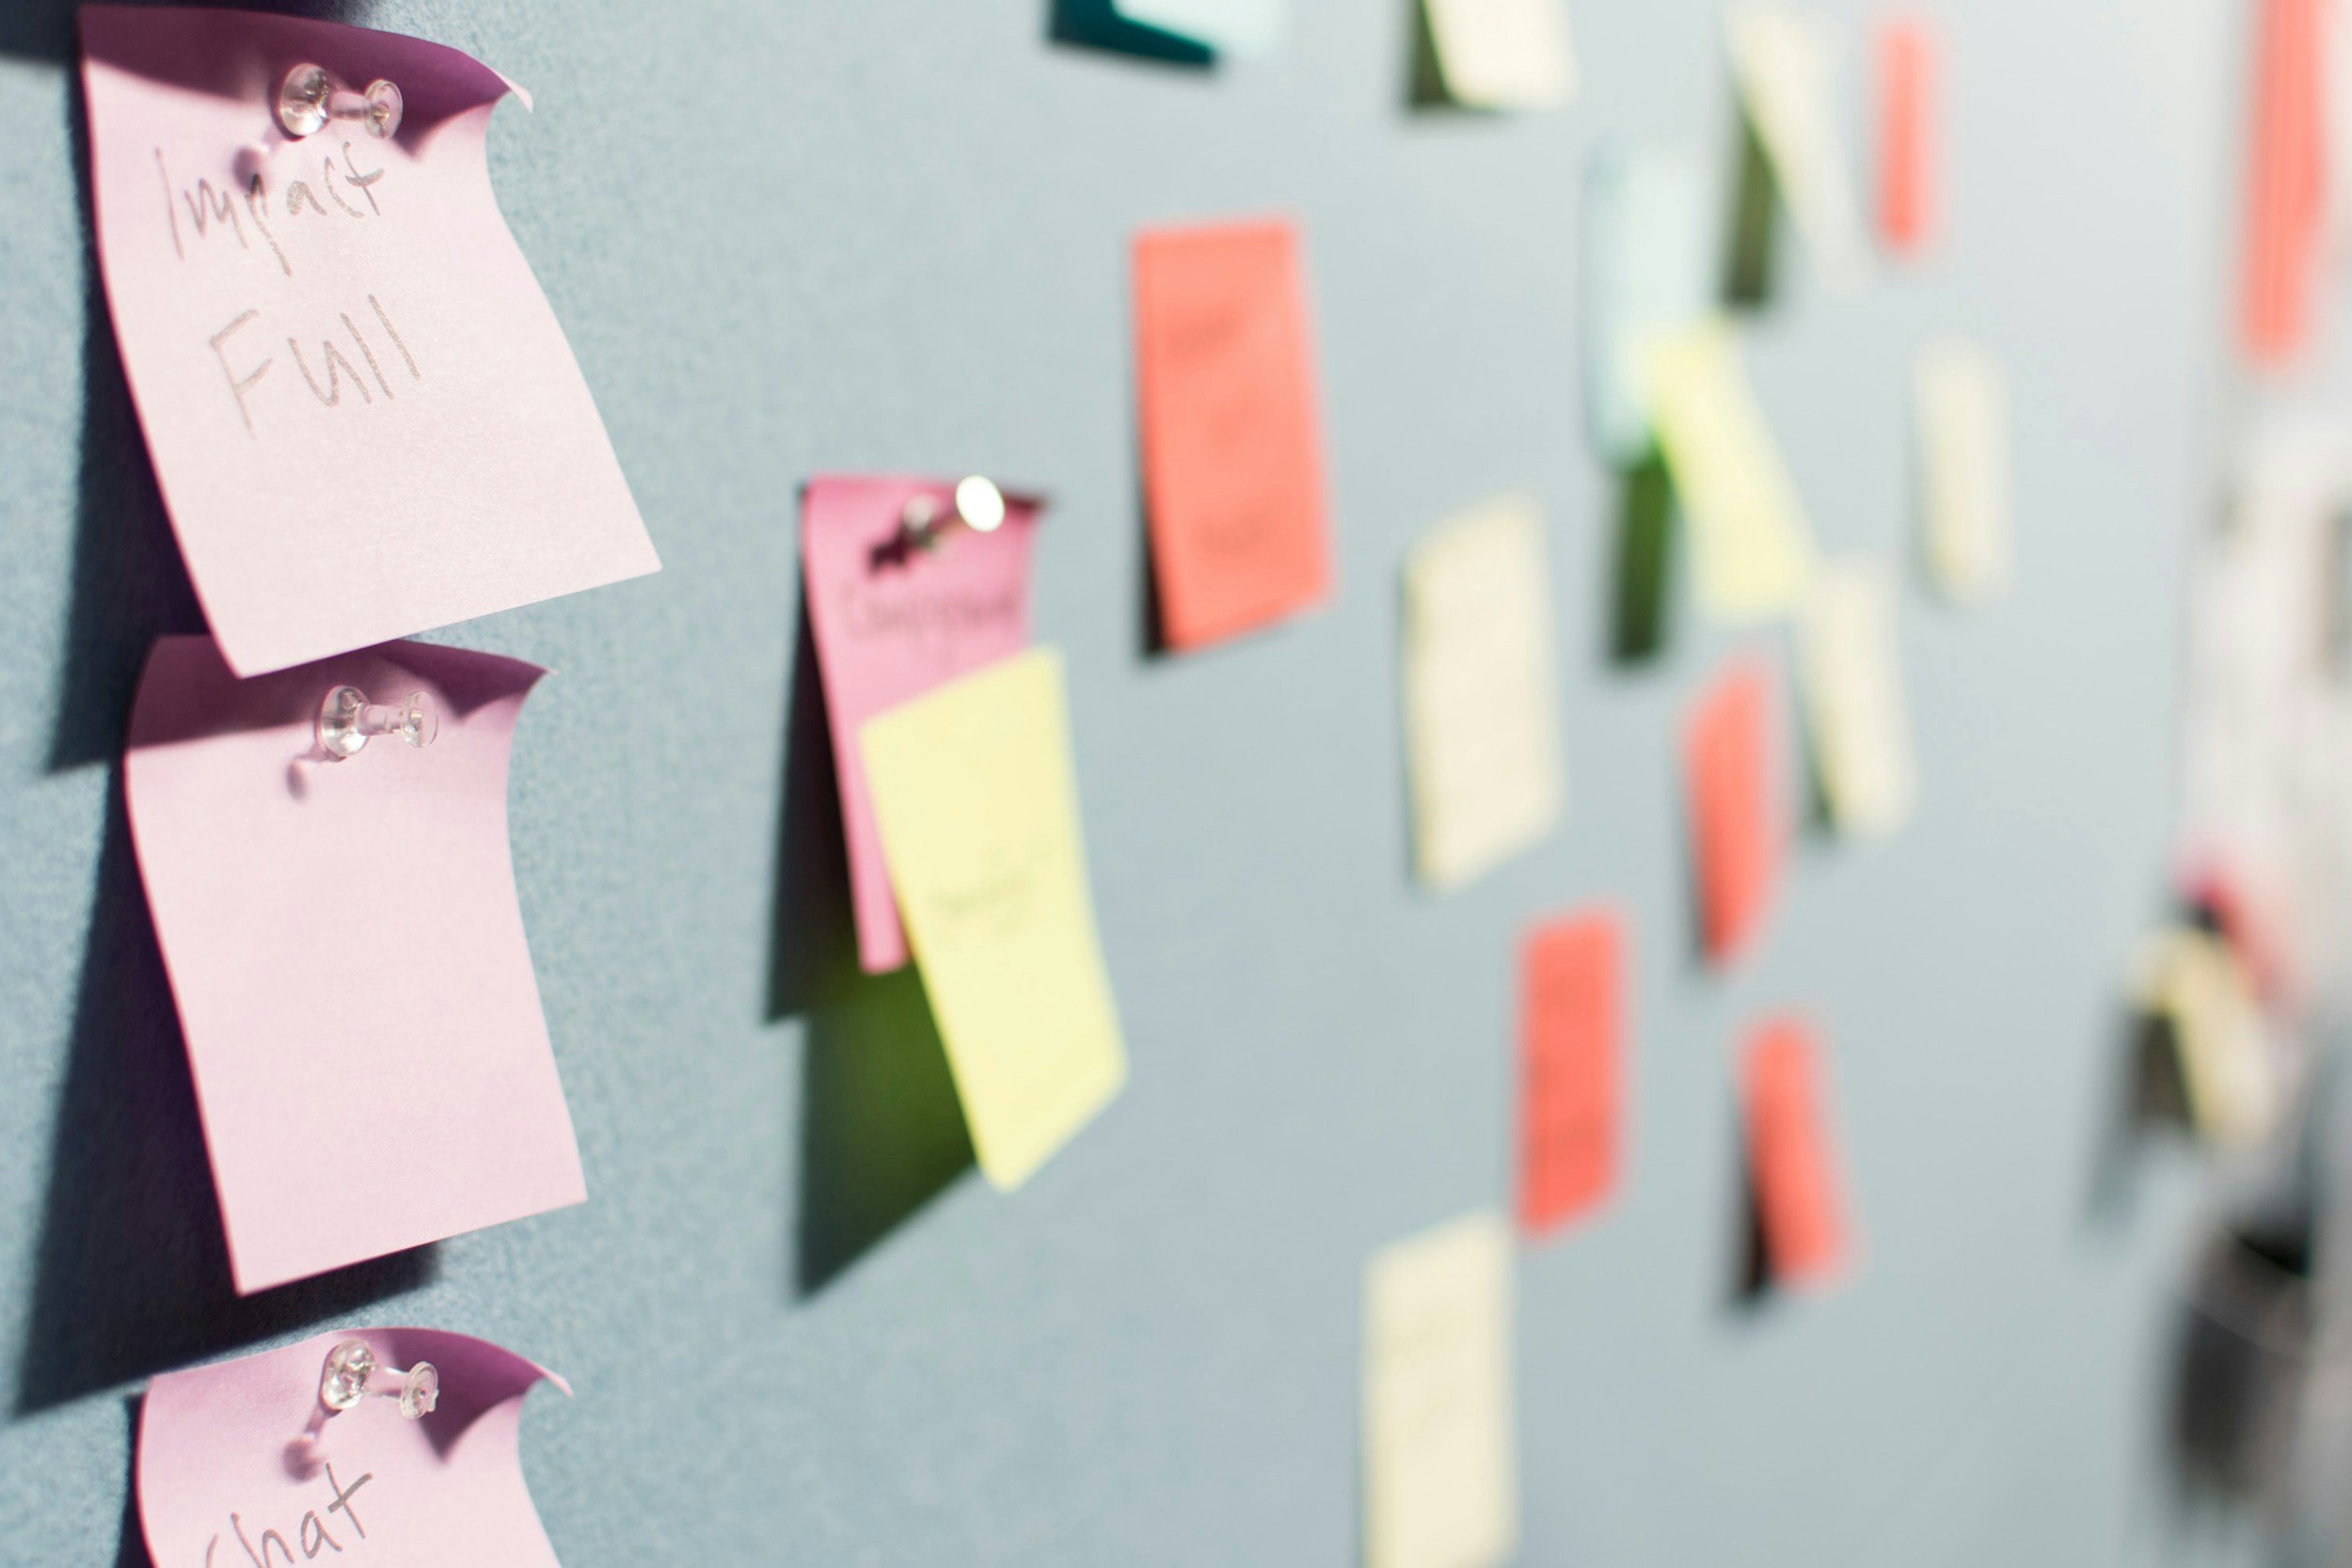
Affinity Maps
In order to involve stakeholders, I asked designers, developers, and managers of the different developer tools teams to participate and collaborate in an affinity mapping exercise in order to find emerging patterns or themes within the interview data.
Data Coding
I analyzed over 600 survey responses by coding qualitative data to identify key themes and patterns, and created visualizations to clearly communicate insights and support data-driven decisions

Affinity Mapping

Survey Coding
Data Visualizations


Insights
01
Users value demos or walkthroughs during the onboarding process
02
Users want to access additional support but don’t where to go
03
Users don't think the tool is intuitive
04
Users value efficiency and automation
05
Users value visual design as a part of their user experience
Recommendations
01
Create a short demo video of how to use the tool
02
Make it easy for users to access and find these walkthroughs
03
Prioritizing intuitive design and add customization where possible
04
Adding more automation where possible, such as “poking” features and automated reminders
05
Creating a simpler, more consistent and more modern UI
Output
I produced and presented 3 slide decks to 4 teams total: the developer tools teams and the design teams of each of the 3 tools.
These presentations included deliverables, such as affinity diagrams, survey analysis, research insights, and recommendations.
Stakeholders expressed strong satisfaction by the amount of feedback users gave about the tools and explained their plans to implement my design recommendations.
Takeaways
Empathy
This project challenged me to apply empathy and user-centered design thinking throughout the research process. I learned how to adapt my UX research plan to better align with user needs and gather meaningful feedback.
Flexibility
Working in a large, multidisciplinary team taught me to navigate a fast-paced environment. I learned to manage deadlines, collaborate across different teams, and stay flexible as project goals evolved.
Industry Experience
This experience deepened my understanding of UX research methods such as journey mapping, affinity mapping, empathy mapping, design thinking, and analytics. Engaging directly with users gave me hands-on experience and reinforced my desire to continue working in UX—especially in roles that involve real-world impact
If I had more time, I would have:
created a mockup of the updated interface to guide design changes
conducted concept testing to to validate design ideas resulting from my research recommendations